

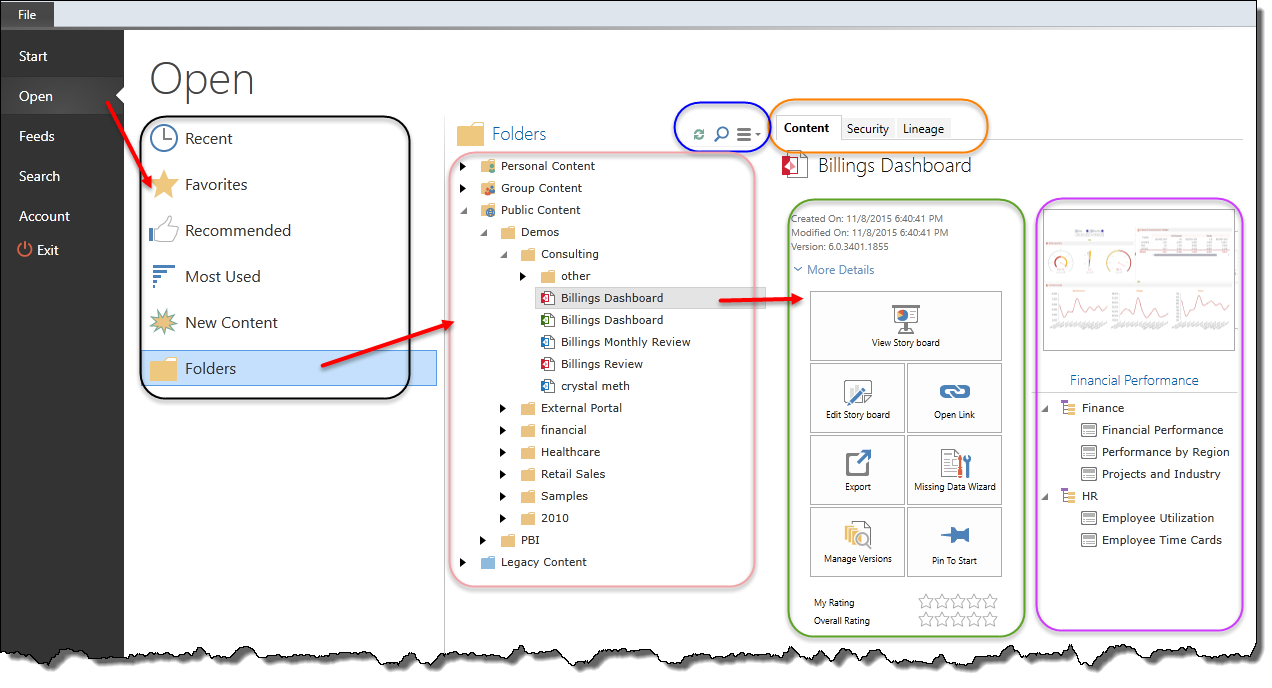
Open Content Screen
Content that has been created and saved can be can be re-opened from the Open page in the backstage.
Content Listings
The Open page provides several listing types (see black highlighting below):
- Recent
- Favorites
- Recommended
- Most Used
- New Content
- Folders
The different listing types provide convenient shortcuts to finding various items, while the Folders represent the main framework for housing, securing and sharing content in BI Office.
Folders
The folder interface is the main method for accessing your content. It is a hierarchical tree structure listing of all the content items for which you have READ access (at least). Once you have found what you want, there are various ways of opening or viewing the content.
Domains
There are four content domains in the folder structure (pink highlight above):
- Personal domain is available to consumers, analysts and professional users and reflects their personal workspace that is not accessible by any other users except administrators. Users are free to open and ultimately save content into the private domain at will.
- Group domain is available to analyst and professional users only and represents a workspace appropriate for analysts only.
- Public domain is available to all users (viewers included). However, only professional users can publish content to this domain.
- Legacy domain is optionally available if BI Office has been wired up to a legacy ProClarity PAS repository.
NOTE: Power BI content is imported into the three main content domains directly. Read more on Power BI content and third party content.
Content Access
Your access is governed based on your license type, and role access to folders (individual content items within each folder).
More detail on content access and functional security is covered in the security section of help.
Content Interface
An item can be selected from the folder tree (or listing item) to drive the different functions related to each item type (pink highlight above). The different icons indicate which application the content relates to: Folders, Data Discovery, Story Board, Publications and others (like ProClarity and Power BI).
When you click on the item, the CMS will load up its meta data, function panel (green highlight above) and a cover flow of thumbnails that reflect the last screen shots of its contents (purple highlight above).
- For Data Discovery, the cover flow will show each report in the analytics book.
- For Story Board, the cover flow will show each slide in the dashboard deck.
- For Publications, the cover flow will show the start page of the publication document.
- For folder and other types, no cover flow will be shown.
Cover Flow & Metadata Tabs
When a user selects an item in the tree, the interface presents a series of tabs (orange highlight above) that are relevant to the item.
- Content tab shows metadata about the book (or deck) including its name, description, create date, last modified date and last modified user tag.
- Security tab (not visible in the Personal domain, for root folders and ProClarity content) is used for setting role based security access for the current item.
- Lineage tab is used for viewing and using the data lineage interface. Data lineage gives users a holistic view of their content, its use and metadata.
- The "schedules" and "publications" tab are used to set and manage schedules for publication templates as well as view the output from previously launched publication jobs.
NOTE: Certain tabs are only visible for certain item types.
Function Buttons
The function buttons give users access to the relevant functions for that item type.
Specific Buttons
Data Discovery
- "Open Report" button will open the currently selected report in the cover flow into the data discovery tool.
Story Board
- "View Story Board" button will launch the current story board into "run-time mode" for consumption of the story board. The run time always starts with the first slide.
- "Edit Story Board" button will open the current story board into the "designer mode" for editing of the story board.
Publication
- "Schedule Publication" button will open the scheduling interface for creating and editing new schedules for running publication jobs.
- "Edit Publication" button will open the current publication into the "designer mode" for editing the current publication template.
Power BI
- "Download" button will open a browser dialog to download the underlying "PBIX" file associated with the item.
- "Open Report" will open the current Power BI item in the lite viewer mode for consumption.
Common Buttons
These buttons are common to all three modules (but not folders or other content types).
- Open Link button will open a dialog to build a hyperlink string for embedding in email or sending to other users (not available for publications). Also see here for more.
- Export button will launch a dialog to export the current selection as a PAXL file.
- Missing Data Wizard will launch the report and a data source reconciliation engine
- Manage Versions will launch the versioning interface for viewing, opening and managing different versions of the current item
- Pin to Start will pin the current item to the Start page as one of your 'favorites' (not available for publications). See below for more.
Content Ratings
The user driven content rating interface is presented below the function buttons.
Users can set their rating for the current item using the top row of stars through simple clicking. The bottom row of stars reflects the community's average review for this item.
The items with the highest reviews are viewable in the "Recommended" content listing.
Folder Quick Menu
The quick folder menu (blue highlight above) gives users access to content management tools that can be run across the entire folder tree structure. See here for more.
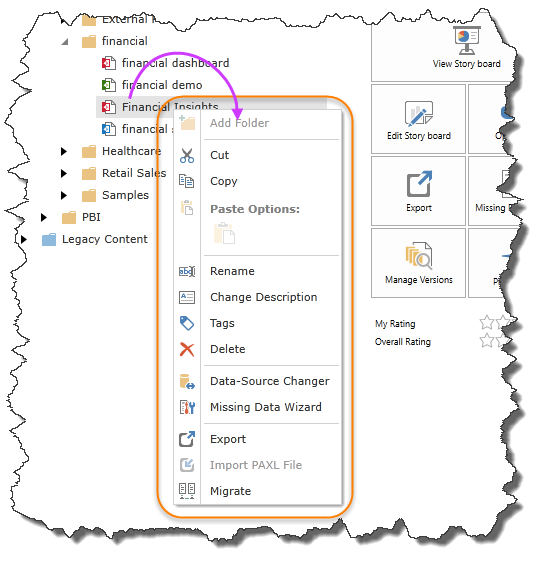
Content Context Menu
Right clicking on items in the folder trees will present a rich context menu for further managing content (orange highlight below). See content management for more.
Opening Content
Depending on the type of content chosen, there are a few ways to open the content.
Data Discovery:
- Click through the cover flow images and click on the image
- Click on the report in the report tree
- Select either an image or an item in the tree and click the "Open Report" function button.
Story Board:
- Click through the cover flow images and click on the image - this will open the designer
- Click on the slide in the slide tree - this will open the designer
- Click the "edit Story Board function button - this will open the designer
- Click the "View Story Board" button to open the story board in run-time mode
Publication:
- Click the image in the cover flow - this will open the designer
- Click the "Edit Publication" button - this will open the designer
Pinning Content
To select your favorite items use the "pin to start" function button for the currently selected item. This will add it to both your favorites content listing as well as the Start page for the main application.
Home |
Table of Contents |
Index |
User Community
Pyramid Analytics © 2011-2022